
A Data-Driven Analysis of Bicycle Injury Rates (2021–2023)
When people ask where it’s safest to ride in Central Contra Costa or the Tri-Valley, they usually expect a quick answer.
Instead, we ran the numbers. 
Using official California crash data from OTS Crash Rankings* for bicyclists killed or injured in reported crashes from 2021–2023, we analyzed:
- Lafayette
- Orinda
- Moraga
- Pleasant Hill
- Concord
- Walnut Creek
- Danville
- San Ramon
- Pleasanton
- Dublin
- Livermore
Then we adjusted for population.
Because raw crash totals don’t tell the whole story.
*Data sourced from the California Office of Traffic Safety rankings (based on SWITRS crash records) and the Transportation Injury Mapping System (TIMS) (hosted by UC Berkeley).
Why Raw Bicycle Crash Numbers Can Be Misleading
At first glance, Concord shows far more bicyclist injuries than Lafayette.
But Concord has more than 120,000 residents. Lafayette has about 25,000. Comparing raw totals alone doesn’t tell us who is statistically more at risk.
Comparing raw crash totals only answers the question:
Where do the most crashes happen?
It does not answer:
Where is an individual cyclist statistically more at risk?
So to evaluate this, we calculated: Bicyclist injuries per 100,000 residents (2023). This is a standard public-health method known as per capita analysis. It levels the playing field between cities of different sizes.
Safest Cities to Bike (Per Capita, 2023)
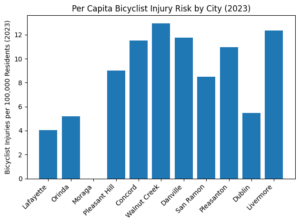
After adjusting for population, here’s what the data shows.
Note: Population figures were drawn from 2023 California Department of Finance city population data.
Lowest Per-Capita Bicycle Injury Rates
- Moraga
- Lafayette
- Orinda
Mid-Range Injury Rates
- Dublin
- Pleasant Hill
- San Ramon
Highest Per-Capita Injury Rates
- Walnut Creek
- Livermore
- Concord
- Danville
Notably, Walnut Creek slightly edges out Concord on a per-capita basis – even though Concord has more total crashes.
That’s exactly why population adjustment matters.
What This Data Actually Tells Us About Bike Safety 
Based on 2023 per-capita injury rates:
Lamorinda currently shows the lowest relative bicyclist injury risk among the cities analyzed.
This result may surprise riders familiar with the area’s narrow roadways and winding corridors. Our conclusion deserves context.
The Analytical Caveats (And Why They Matter)
A serious safety discussion requires acknowledging limits.
-
We Used Total Population – Not Number of Cyclists
Per-capita calculations use city population as the denominator.
Ideally, we would measure:
Bicycle crashes per bike mile traveled.
That would give us true exposure risk.
But cities rarely track ridership volume at that level. So population becomes a consistent – though imperfect – proxy.
If a city has significantly higher ridership, higher crash numbers may reflect more people biking, not necessarily more dangerous conditions.
-
This Includes Injury & Fatal Crashes Only
The data includes reported roadway crashes where a bicyclist was killed or injured.
It does not include:
- Property-damage-only incidents
- Solo falls without police reports
- Near misses
- Trail-only collisions
This is police-reported roadway crash data.
-
Small Cities Can Swing Dramatically
In smaller cities like Moraga, one serious crash can significantly change the rate from year to year.
That’s why multi-year trend analysis is more reliable than single-year snapshots.
What This Means for Cyclists in Contra Costa & the Tri-Valley

This analysis doesn’t identify specific dangerous intersections. It doesn’t rank infrastructure quality.
It does show this:
When adjusted for population, larger suburban cities like Walnut Creek, Concord, and Livermore show higher bicyclist injury rates than Lamorinda towns.
That raises important planning questions:
- Are arterial road designs contributing?
- Are vehicle speeds higher?
- Is cycling volume significantly greater?
- Are there infrastructure gaps in high-growth areas?
Those are policy and infrastructure conversations – not just legal ones.
And good safety policy starts with honest data analysis.
Takeaways for Cyclists
To recap, using available per-capita injury rates from 2023:
Lamorinda currently shows the lowest relative bicyclist injury risk among the cities reviewed.
But safety is dynamic. Infrastructure changes. Ridership changes. Growth changes traffic patterns.
Which means this conversation shouldn’t end with a ranking.
It should continue with better data – and better design.
If You’re Injured While Cycling, Contact Paceline Law
By riding in a paceline, cyclists reduce wind drag by up to 50%. Hiring a lawyer should work the same way—reducing friction and making the legal process smoother.
If you’ve been injured in a bike or e-bike accident, I’m here to advocate for you and take on the headwinds of your legal challenges. Let’s move forward together.